
Markets in correction
This is the Kvarn Pulse newsletter, which reviews current events in the cryptocurrency markets and macroeconomics.
Week by numbers
Past week has seen a sharp downward trend in the cryptocurrency market. The price of Bitcoin, the largest cryptocurrency, fell by approximately eleven percent, while the price of Ether, the second-largest cryptocurrency, dropped by around fourteen percent. The total market value of the broader cryptocurrency market (excluding the largest stablecoins) decreased by about eleven percent.

Within the internal dynamics of the cryptocurrency market, one unusual development during the downtrend was that the altcoin market held up better than Bitcoin, the largest cryptocurrency. On the other hand, as expected, the price of Ether declined more than Bitcoin’s price. This led to a somewhat atypical outcome where both Bitcoin dominance and the ETH/BTC ratio, which usually move inversely, both ended up in negative territory.

Despite the overall bearish trend in the cryptocurrency market, some individual tokens experienced significant price increases. Among the tokens traded on the Kvarn X trading platform, the biggest weekly gainers were MKR (+45%), TIA (+9%), and SEI (+8%). Conversely, the biggest losers of the week were RAY (-45%), MNT (-27%), and LDO (-16%).

Market in a Correction
In last week’s Kvarn Pulse newsletter on Thursday, February 20, 2025, we discussed the divergence between stock and cryptocurrency market developments. We highlighted the observation that while the stock market had risen strongly over the past week, the cryptocurrency market had remained stagnant in a sideways movement.
In our analysis, we posed the question:
"The market trends of recent weeks raise an obvious question: if Bitcoin is moving sideways while the stock market is rising, how will it react when the stock market inevitably undergoes a corrective downturn?"
Answers to this question began to emerge later that same day when the previously strong-rising stock market turned downward.
The S&P 500 index, has since declined for five consecutive trading days since last Thursday, amounting to a total drop of approximately three percent over the past week.

In last week’s Kvarn Pulse newsletter, we anticipated that while rising stock prices had not pulled the cryptocurrency market upward, a stock market downturn was more likely to push cryptocurrency prices lower. This indeed happened, with Bitcoin’s price dropping by about fifteen percent from its Thursday peak.

We make two observations regarding the price movements of the past week, which we will examine in more detail below.
Longer-Term Perspective: Range breakdown?
1. The first point is quite clear from a technical analysis perspective. After the U.S. presidential elections in November, we witnessed an explosive upward movement in the cryptocurrency market, which drove Bitcoin’s price up by about 50% in just a few weeks.
2. Following this surge, Bitcoin's price formed a trading range just below its fresh all-time highs, fluctuating between $90,000 and $110,000.
The price failed to set new records but found enough buyers around the $90,000 level to prevent a further decline.

The first warning signs appeared last week. As we covered in the previous Kvarn Pulse newsletter, the stock market’s rise was no longer sufficient to push Bitcoin’s price to the upper boundary of its range, as the rally stalled below $100,000. The stock market’s downturn, in turn, led to the breakdown of the range with Bitcoin’s price falling to as low as $82,500 on Wednesday, February 26, 2025. Simultaneously, the price dropped well below the 100-day moving average, which many consider a sentiment indicator for the market.
Our interpretation is that the euphoric sentiment that began with the U.S. presidential elections temporarily overheated cryptocurrency valuations, and since the start of the year, we have been witnessing a natural cooling-off phase following this overheating. It is important to note that even after last week’s steep correction, Bitcoin’s price remains approximately 60% higher than its early September low.
After such a sharp decline, the natural question is whether the bottom has been reached or if further declines are still ahead?
From a purely technical analysis standpoint, it is not entirely clear where the next support levels lie after the $90,000 level was breached. In November, Bitcoin’s price surged from $70,000 to over $90,000 in a single move. While we consider it unlikely that the price would drop all the way back to $70,000 in the near future, pinpointing the exact location of the next support level seems rather difficult.
As a note of caution, we highlight that the S&P 500 index remains significantly above its local lows from December and January.

If stock market caution persists and these lows are revisited, it could also drag the cryptocurrency market downward. However, our assumption is that in the immediate future, this is unlikely to happen, as we will discuss next.
Shorter-Term Perspective: Buying Opportunities?
From a longer-term perspective, the breakdown of the range formed below Bitcoin’s price peak raises some concerns, and at least prompts the question of whether the top of this market cycle has already passed.
On the other hand, for short-term traders, the situation could present an interesting buying opportunity.
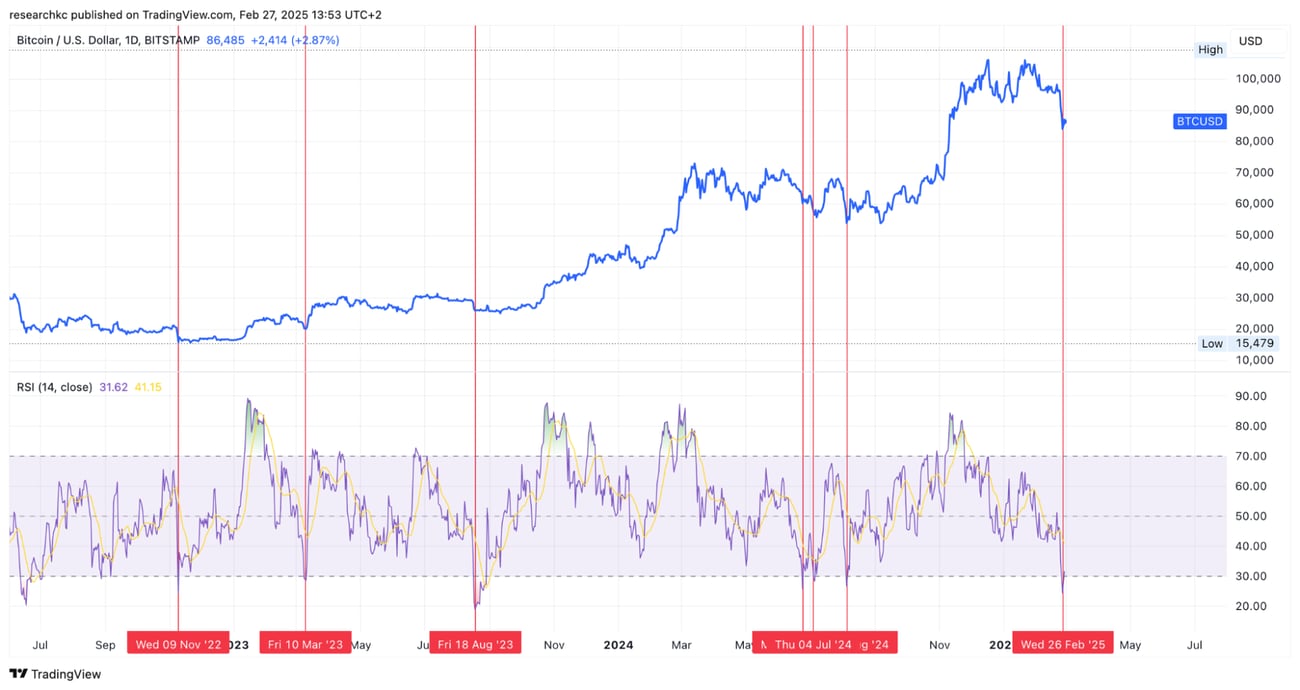
As noted, the recent price drop has been very steep, making the market appear temporarily oversold according to various indicators. For instance, Bitcoin’s daily Relative Strength Index (RSI) fell below 25 on Wednesday, February 26, 2025.
The accompanying chart highlights past instances in recent years when the RSI has been this low. The chart shows that when the RSI has reached such low levels, the immediate price decline has often been close to bottoming out.
There are also some signs supporting a potential local bottom forming in the stock market. The S&P 500 index has dropped all the way from its upper Bollinger Band to its lower band within one week, suggesting that further downside may be limited.
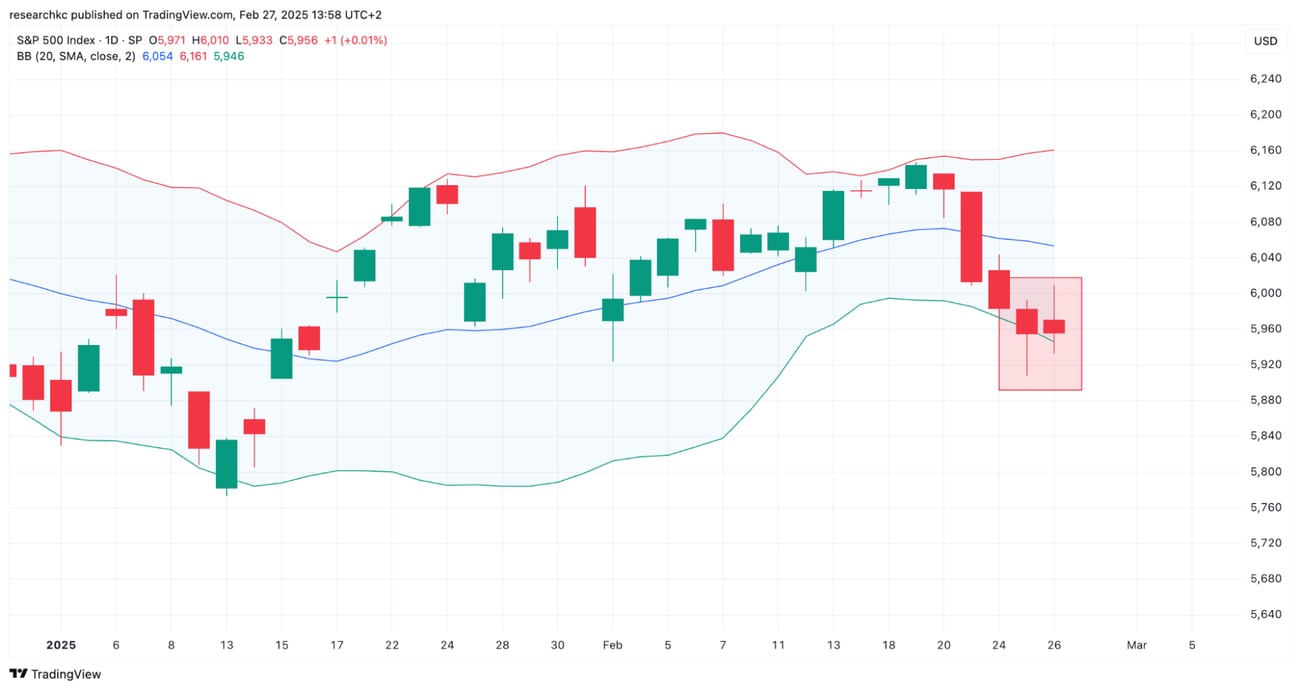
Additional support for a trend reversal can be seen in recent candlestick patterns, where downside wicks have started to appear—a phenomenon often observed before a trend reversal. Another indication is that on Wednesday, the S&P 500 index ended marginally higher than Tuesday’s closing level, despite receiving negative news during the day regarding U.S. import tariffs on EU goods.
The sharp decline in cryptocurrency prices over the past week raises questions about the current stage of the market cycle and warrants close monitoring of whether the two-year-long uptrend in the cryptocurrency market remains intact.
For those interested in short-term trading, the situation may offer interesting opportunities. However, in short-term trading, it is crucial to be able to exit a trade quickly if the hypothesis of an oversold bounce proves incorrect.
With these thoughts, we leave our readers to monitor the cryptocurrency market’s intriguing situation following this correction.
We will be back next week with another edition of the Kvarn Pulse newsletter—stay tuned!
